import matplotlib.pyplot as plt
import numpy as np

def plot_chargaffs_rules():
    bases = ['A', 'T', 'C', 'G']
    sns.set_theme(style="whitegrid")
    # Fictional relative amounts
    amounts = [20, 20, 30, 30]  # A:T and C:G have the same amounts

    fig, ax = plt.subplots(figsize=(8, 6))

    bars = sns.barplot(x=bases, y=amounts,
                       palette=['tab:red','tab:blue','tab:green','tab:orange'],
                       ax=ax,edgecolor='k')

    # Highlighting the equal amounts


    for p in ax.patches:
        h, w, x = p.get_height(), p.get_width(), p.get_x()
        xy = (x + w / 2., h / 2)
        text = f'{h:0.0f}%'
        ax.annotate(text=text, xy=xy, ha='center', va='center',color='white',size=18)

    ax.set_ylim(0, max(amounts) + 5)
    ax.set_xlabel('Nucleotide Bases')
    ax.set_ylabel('Relative Amount (%)')
    ax.set_title("Illustration of Chargaff's Rules")
    #ax.grid(axis='y', linestyle='--', linewidth=0.7, alpha=0.7)

    plt.tight_layout()
    plt.show()

plot_chargaffs_rules()
Nucleic Acids Biophysics
Nucleic Acid Structure
Primary Structure
Nitrogeneous Bases
Purines
There are two purines that are in DNA and RNA:Pyrimidines
Thymine only appears in DNA. In RNA, it is replaced by the similar Uracil.Sugar
RNA vs DNA
Besides Uracil vs Thymine, there is another chemical difference between DNA and RNA. RNA has a hydroxyl group on the 2' carbon while there is only a hydrogen attached to the 2' carbon in DNA.The absence of the 2' hydroxyl group in DNA's deoxyribose sugar contributes to its stability. The hydroxyl group in RNA’s ribose makes RNA more susceptible to hydrolysis, especially under alkaline conditions, limiting its stability relative to DNA. It can nucleophilically attack the phosphorous in the phosphodiester linkage, catalyzing the breakage of the link between the two nucleotides. . This difference in stability is critical as DNA needs to store genetic information reliably, while RNA acts primarily in temporary roles like protein synthesis.
Secondary Structure
Base Pairing
Hydrogen Bonding
Base-pairing involves hydrogen bonding between two bases on different helices. This is not the main driver of the formation of double helices, but it does have the following advantages:- Allows for bases to come together without enthalpic penalty from not being able to hydrogen bond with water
- Allows for detection of bases and specificity of base-pairing
Canonical Base Pairs
Also known as Watson-Crick base-pairs, these are the normal nucleic acid pairings in nucleic acids.- DNA:
- Adenine-Thymine (A-T): Forms two hydrogen bonds.
- Cytosine-Guanine (C-G): Forms three hydrogen bonds.
- RNA:
- Adenine-Uracil (A-U): Forms two hydrogen bonds.
- Cytosine-Guanine (C-G): Forms three hydrogen bonds.
Chargaff's Rules
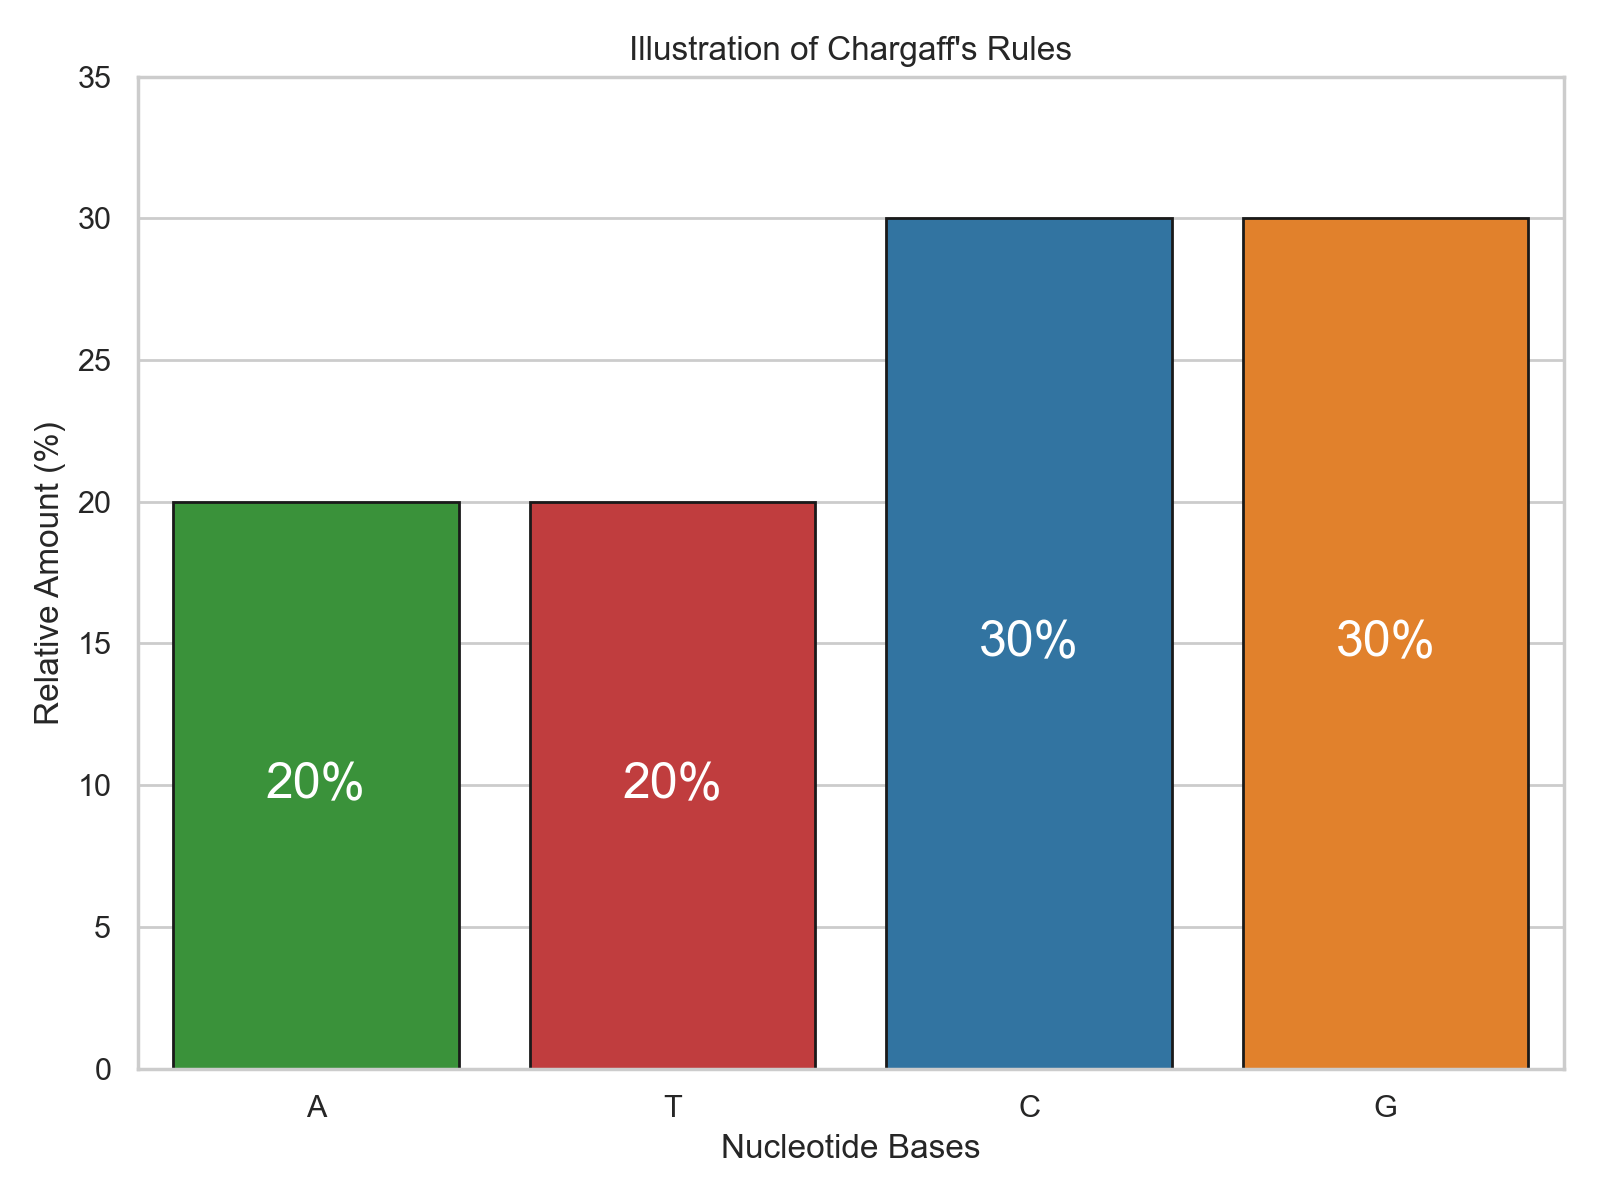
Because A is always paired with T, the amount of A must be equal to the amount of T. A similar relationship holds between amount of G and C. This is known as Chargaff's rules, and it holds very well in DNA, where there is very little mismatching.
Hoogsteen Base-Pairing
Hoogesteen base-pairing is an alternative hydrogen bonding pattern.Wobble Base-Pairing
In tRNA, the final base in the codon is less restricted than traditional Watson-Crick base pairing.Base Tautomerism
It is possible for the bases to undergo tautomerization. Keto groups can convert to enols. Amines can convert to imines. Both of these changes reverse the role of that group being a hydrogen donor versus acceptor. This changes the hydrogen bonding pattern, promoting base mismatching and thus mutations.Double Helix
Base Stacking
Much of the free energetic drive for double helix formation comes from base stacking. There is the enthalpic contribution from pi orbital overlap with the neighboring bases. There is also an entropic contribution from water not having to solvate the bases.Example: Ethidium Bromide
Ethidium bromide is an intercalating agent, which means that it can bind between stacked bases. Ethidium bromide is used for detection and visualization in gel electrophoresis.Antiparallel
Major and Minor Grooves
As the strands twist around each other, the spatial alignment of the bases results in the formation of two distinct grooves. The major groove is wider in B form DNA, while the minor groove is roughly half as wide; however, the minor groove is deeper. Because of the major groove's wideness, it provides more accessible space for proteins to interact because more atoms of the base pairs are exposed.A Form, B Form, Z Form
A-form
- Commonly seen in RNA double helices and DNA-RNA helices
- Right handed
- 11 base pairs per turn
- Helix is shorter and wider than B-form
- Deep and narrow major groove
B-form
- Common conformation for DNA
- Right-handed
- 10 base pairs per turn
- Wide, shallow major groove
Z-form
- Left-handed
- 12 base pairs per turn
- Less distinction between major and minor grooves
RNA motifs
Since RNA commonly exists in a single-stranded state, unlimke DNA, more variety in structure is observed.Stem-loops
Single strand RNA base pairs with itself, forming a stem. Unpaired bases between the two segments form the loop. Also known as a hairpin loop.Bulges
Bulges are short unpaired regions in between paired regions.Higher Structures
Supercoiling
While there is natural twisting due to the local twisting along the helix, there can also be a global twisting.Twist
This refers to the number of helical turns in the DNA double helix. Imagine a ladder that represents the DNA. If you were to count the number of rungs (base pairs) and then determine how many times one side of the ladder spirals around the other, you would be calculating the twist. In canonical B-DNA, there are approximately 10.5 base pairs per turn (or twist). Changes in the twist would mean either overwinding or underwinding from this standard configuration.Writhe
This describes the coiling of the DNA helix axis in space, almost like the loops in a roller coaster track. It signifies how many times the double helix crosses over itself. Positive writhe indicates right-handed supercoiling, while negative writhe indicates left-handed supercoiling.Linking Number
Linking number is the number of times one DNA strand wraps around the other. It is a topological property, meaning it remains constant unless DNA is broken. Lk can be partitioned into the sum of twist and writhe: \(Lk=Tw+Wr\)Epigenetics
Epigenetics explores the mechanisms by which gene expression is regulated without alterations to the underlying DNA sequence. This layer of genetic control is crucial for many biological processes, including development, differentiation, and response to environmental stimuli.Common Types
DNA Methylation
Methylation of cytosine bases, particularly at CpG dinucleotides, is a common epigenetic mark. DNA methylation generally represses gene expression by obstructing the binding of transcription factors or recruiting methyl-binding proteins that further recruit repressive chromatin modifiers.Histone Modification
Histones, the protein spools around which DNA is wrapped, can be modified in various ways, including acetylation, methylation, phosphorylation, and ubiquitination. These modifications alter the structure of chromatin (the complex of DNA and histones) and, consequently, the accessibility of DNA to the transcriptional machinery.Physical Properties of Nucleic Acids
Denaturation

GC Content
Because the GC pair has 3 hydrogen bonds while AT has 2, DNA that has a higher percentage of G's and C's in it will be harder to separate. This is an evolutionary trick that is used by organisms that live in high temperature environments.UV Absorption
When UV light interacts with molecules, electrons can be excited from their ground state to an excited state. For nucleic acids, the primary absorbing components are the nitrogenous bases. They strongly absorb UV light around 260 nm, making this wavelength ideal for nucleic acid quantification.Hyperchromic Effect
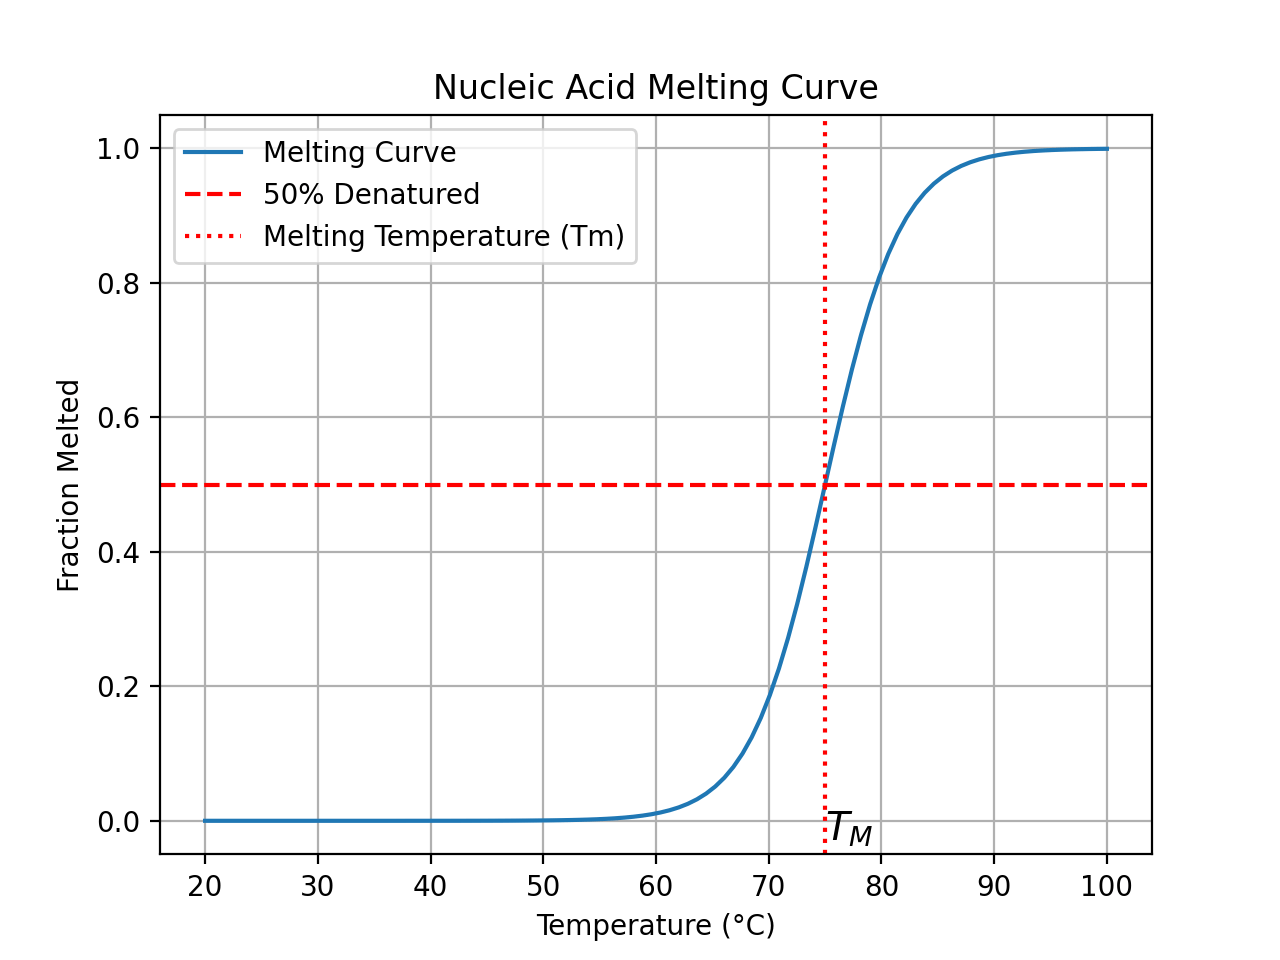
Upon denaturation (e.g., heating), the UV absorbance of nucleic acids increases, a phenomenon called the hyperchromic effect. This is because the stacked bases in the double-helical structure become unstacked upon denaturation, leading to increased delocalization and hence higher absorption. Monitoring the hyperchromic effect can help determine the melting temperature \((T_m)\) of nucleic acids, which is a measure of their stability.Uses
Quantification of Nucleic Acids
Since the absorption of UV light is proportional to the concentration of nucleic acids, spectrophotometers are used to determine the concentration of DNA or RNA in a sample by measuring its absorbance at 260 nm.Purity Assessment of Nucleic Acids
The ratio of absorbance at 260 nm to 280 nm (A260/A280 ratio) provides information about the purity of a nucleic acid sample. Pure DNA typically has an A260/A280 ratio of ~1.8, while pure RNA has a ratio of ~2.0. Deviations from these values can indicate contamination, often from proteins.Chemistry of Nucleic Acids
Energy Storage
Why Nature Really Chose PhosphateNucleic Acid Practice Questions
- Describe the basic structure of a nucleotide.
- What are purines and pyrimidines? How do they relate to nucleic acids?
- Describe the structural differences and similarities between DNA and RNA.
- What is the role of the phosphate group in the structure and function of nucleic acids?
- Explain the significance of base-pairing in the structure and function of nucleic acids.
- How do hydrogen bonds facilitate base-pairing in nucleic acids?
- What would be the consequences of non-canonical base-pairing for the structure and stability of nucleic acids?
- Describe the structural differences between A-form, B-form, and Z-form of DNA.
- Define GC content and explain its significance in nucleic acid stability.
- How does GC content affect the melting temperature of a DNA molecule?
- Explain the concept of melting temperature in the context of nucleic acid structure.
- How do the number and type of base pairs in a nucleic acid strand influence its melting temperature?
- Distinguish between purines and pyrimidines in terms of structure and examples.
- Why do purines pair with pyrimidines in the structure of nucleic acids?
- How does the melting temperature correlate with the thermophilic nature of some organisms?
- Contrast the major and minor groove.