            import numpy as np
            import matplotlib.pyplot as plt

            # Define the system parameters
            m = 1  # mass
            k = 1  # spring constant

            # Damping values: c1 for underdamped, c2 for overdamped, and c3 for critically damped
            c1 = 0.5  # underdamped
            c2 = 3    # overdamped
            c3 = 2 * np.sqrt(m*k)  # critically damped

            # Time vector
            t = np.linspace(0, 10, 1000)

            # Responses
            # Underdamped response
            omega_0 = np.sqrt(k/m)
            zeta1 = c1 / (2 * np.sqrt(m*k))
            omega_d1 = omega_0 * np.sqrt(1 - zeta1**2)
            phi = np.arctan(np.sqrt(1 - zeta1**2) / zeta1)
            x1 = (1/np.sqrt(1 - zeta1**2)) * np.exp(-zeta1 * omega_0 * t) * np.sin(omega_d1 * t + phi)

            # Overdamped response
            zeta2 = c2 / (2 * np.sqrt(m*k))
            alpha1 = -zeta2 * omega_0 + omega_0 * np.sqrt(zeta2**2 - 1)
            alpha2 = -zeta2 * omega_0 - omega_0 * np.sqrt(zeta2**2 - 1)
            C1 = alpha2 / (alpha2 - alpha1)
            C2 = -alpha1 / (alpha2 - alpha1)
            x2 = C1 * np.exp(alpha1 * t) + C2 * np.exp(alpha2 * t)

            # Critically damped response
            x3 = (1 + omega_0 * t) * np.exp(-omega_0 * t)

            # Plotting
            plt.figure(figsize=(10, 6))
            plt.plot(t, x1, label='Underdamped (Oscillatory)')
            plt.plot(t, x2, label='Overdamped (Non-Oscillatory)')
            plt.plot(t, x3, label='Critically Damped (Fastest Return)')
            plt.axhline(0, color='black',linewidth=0.5)
            plt.axvline(0, color='black',linewidth=0.5)
            plt.xlabel('Time (s)')
            plt.ylabel('Displacement from Equilibrium (cm)')
            plt.title('Underdamped vs. Overdamped vs. Critically Damped Response')
            plt.grid(True)
            plt.legend()
            plt.show()
import numpy as np
import matplotlib.pyplot as plt
import matplotlib.animation as animation
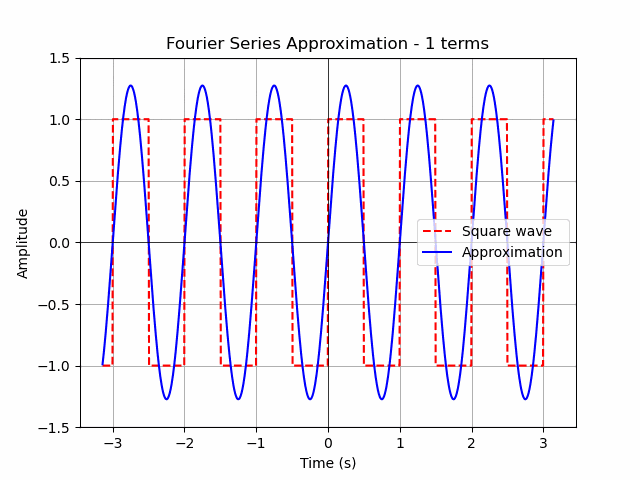
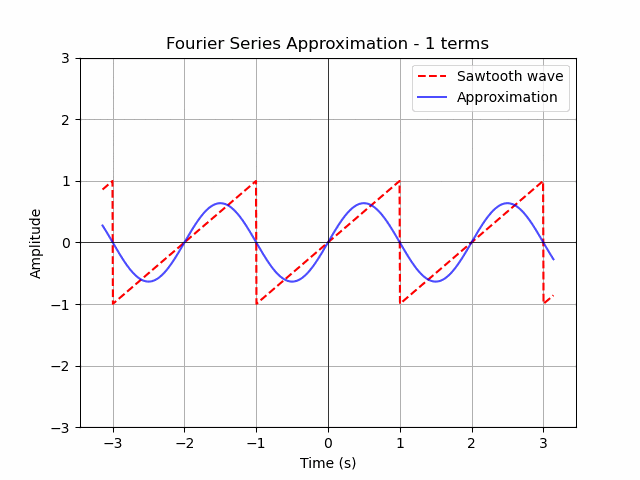
# Define the angular frequency of the square wave
#omega = 2 * np.pi
omega = np.pi
# Define the time array
t = np.linspace(-np.pi, np.pi, 1000)
# Define the number of terms in the Fourier series
n_terms = 50
fig, ax = plt.subplots()
# Plot the original square wave for comparison
ax.plot(t, (t/1-1) % 2 - 1, linestyle='dashed', color='red', label='Sawtooth wave')
line, = ax.plot(t, np.zeros_like(t), label='Approximation', color='blue',alpha=.7)
ax.legend()
# Customize the plot
plt.axhline(0, color='black',linewidth=0.5)
plt.axvline(0, color='black',linewidth=0.5)
plt.title('Fourier Series Approximation of a Square Wave')
plt.xlabel('Time (s)')
plt.ylabel('Amplitude')
plt.ylim([-3,3])
plt.grid(True)
def init():
line.set_ydata([np.nan] * len(t))
return line,
def update(frame):
n = frame + 1 # n takes only odd values for square wave
fourier_series = sum((2/np.pi) * ((-1)**(n+1) / n) * np.sin(n * omega * t) for n in range(1, n+1))
line.set_ydata(fourier_series) # set the y-data to the computed Fourier series
ax.set_title(f'Fourier Series Approximation - {n} terms')
return line,
ani = animation.FuncAnimation(fig, update, frames=[0,1,2,3,4,9,19,99], init_func=init, blit=True, interval=1000)
ani.save('Fourier-Series-Sawtooth-Wave.gif', fps=1,
#extra_args=['-vcodec', 'libx264']
)
plt.show()